Has anyone used the data in Sailwave to produce turnout statistics or demographic analysis?
If so how have you done it, please?
I have started by importing the JSON file, created by Sailwave, into a database (PostgreSQL) column. I am now struggling to get the data out, which I think should be possible from what I have read. I have been able to get some data out but not the data I need for turnout / demographic analysis.
I want to use JSON because it will allow the import of data from Sailwave files that will have different set-ups but still allow extraction of information for aggregation analysis.
I am using PostgreSQL v17 because it seems to better support including JSON data in a column. I have not looked at Microsoft SQL because I am trying this on my Linux system.
Think I could write a plugin which saved the data to a SQLite database fairly quickly. Certainly the competitor data would be easy. What other info do you need?
I too get asked at the end of each season to produce a list of the club’s most committed members (i.e. those who sailed the most days, not races). So I wondered if there had been any more development of this topic?
I have given up on the route I was trying to follow using PostgreSQL and importing JSON.
However, I am following a different route to get some Sailwave data into a database. I have been provided two different ways of getting competitor data into a database and I am trying to extend to include race data and results information.
A proof on concept from Jon Eskdale in Visual Studio directly accessing a Sailwave file and creating an SQLlite database
A proof of concept by Andy Barrow using Python to import a JSON file created by Sailwave into a MySQL or MariaDB database
As I understand the Python solution better than the Visual Studio I am progressing with the Python route. I can see with this route a way to import into a database in addition to the competitor data, the race & results data that would be required to produce the information you are suggesting you want. It would require race dates to be entered in the race information.
I do it by merging every race to create a huge series. For us thats about 96 races over the year. I then export it from Sailwave to mess about with it in excel. Its also how I calculate new personal handicaps for the following year by exporting all the BCR’s. Its very quick and easy to do.
Much the same as my artistic skills - faced with a blank NotePad++ page I’m lost, but given a working solution I can often adapt the supplied code to my requirements, as least with VBA / PowerShell. That said I have no Python knowledge. I also don’t have access to VS.
Ah, I already have a whole season series for our handicapping using Huw’s EHS template. What do you then do in Excel to see who turned out the most often, and do you use races or days sailed to find that competitor?
You have to decide if you want the number of days a competitor raced or the number of races they competed or both!
If the data is in a database it would, with appropriate SQL queries, be possible to produce all sorts of statistics! A proof of concept written by Jon just exported competitor data from Sailwave into an SQLite data base, which can be opened using applications like HeidiSQL and SQLite Expert Personal for creating SQL queries to produce tables of appropriate information.
SQLite is the most used database engine in the world. SQLite is built into all mobile phones and most computers and comes bundled inside countless other applications that people use every day.
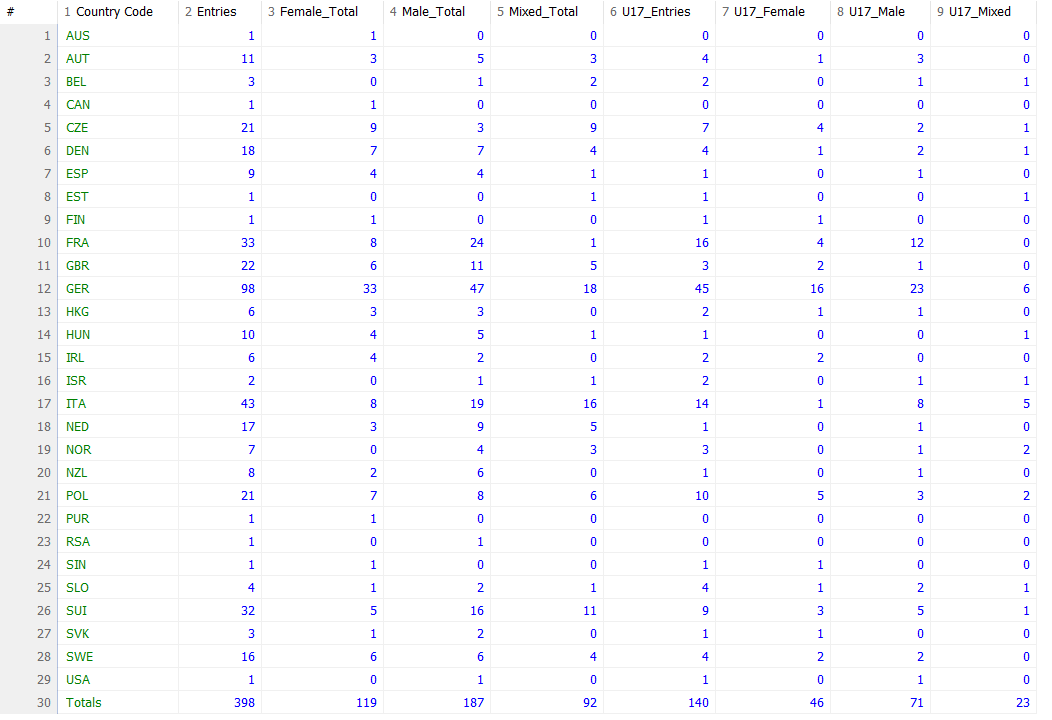
I have imported competitor data from Sailwave via spreadsheet into a database (MariaDB) which allowed an SQL query to generate the following:
The export to clip board from Sailwave for pasting into a spreadsheet does not included any race data apart from the race name. If the race name includes the date that is good, however if the race date has been entered into the date box of race information then it is not copied to the clip board. NOTE - The race date needs to be in the date field of race information if data is being uploaded to RYA PY Online.
If Jon would consider enhancing his proof of concept, which currently only outputs competitor data, to include race information and race results then you could produce all sorts of turnout information with appropriate SQL queries.
A challenge would be deciding what competitor data is written out from a Sailwave file to an SQLite database as there are over 200 fields available in Sailwave, the list can be seen at Field names | Sailwave. It is not appropriate have so many columns in a database table. The race information data and race results information are much more limited and appropriate for being in a race information table and a race results table.
Think HUW pretty much covered it. I do number of races. Then you can do other stuff like performance to handicap, percentages raced etc. Whatever you want really. Its the main way I calculate personal handicaps becuase I knock back any BCR greater than 125% to stop catastrophe handing an advantage. Could do median instead, I prefer to average.
I have just come across the following application, DuckDB https://duckdb.org/, which will read CSV & XLSX spreadsheet files using SQL queries.
I have not taken a deep look yet but first impressions are positive. It might be of interest to those wanting to produce turnout statistics or demographic statistics.
The application is available for Windows, MacOS and Linux platforms.
UPDATE - DuckDB can as already mentioned read CSV & XLSX files and then insert the data into an SQLite, MySQL/MariaDB or PostgreSQL database, So you can then do analysis over number of series, for example.
I have successfully used DuckDB to read a CSV file and create an SQLite database.
The steps I used after installing DuckDB on my Windows11 system were:
open a Sailwave file
use File | Export to clipboard
open a blank spreadsheet
paste the data from the clipboard
save the spreadsheet as a CSV file, in my case it was ztext.csv
open DuckDB
paste the the following SQL statements one at time on the command line
attach 'ztest2.db' (type sqlite);
create table ztest2.sailwave as from 'ztest.csv';
select crewname from ztest2. sailwave;
Note:
ztest2 would be replaced by the database name you want
select crewname… is to show the data has been entered into the database and lists all the crew names
I used the overall results view so imported scored results into database, but if you wanted to analyse corrected times or ratings used you could change the view of data on the screen and export the appropriate data for further analysis.
Having been thinking about using DuckDB overnight, in the way I have used, and it does not make sense over just creating the formulae in a spreadsheet. So still need to finish work on Python script to parse JSON file and load into SQLite.
Especially those who are interested in producing demographic insights and/or club turnout statistics.
I have modified/enhanced a Python script put together by Andy Barrow, a Sailwave user in Mexico, which could extract data from a Sailwave created JSON file and load the data into a MySQL/MariaDB database.
Andy’s Python script only extracted competitor data and the expected JSON file name is hardcoded into the script. My changes:
create an SQLite database file
added the extraction of race and results data as well
added specification of the JSON file name as an argument on the command line
added capability to include on command the the name of the database file to be created, otherwise if not specified the SQLite database file is given the same name as the JSON file with a .db extension
There are some caveats:
The competitor data extracted is most of the default competitor information and not any ‘Extra competitor fields’ if been checked on Setup | User interface or other competitor information that may be available if other options on Setup | User interface have been checked.
Race information does not included start(s) information.
Only been tested on Linux systems.
Python v3.x has been used to develop and test this Python script.
No help on creating SQL queries to extract demographic or turnout statistics
A short guide to using the script has been written.
If you are interested in getting a copy of the Python script, then get in touch.